The article written by Andrei Cain, Presales Engineer at Arctic Stream, is the second part of the series dedicated to Cisco Meraki solutions, continuing the topics introduced in the article “Meraki: what it is and how it simplifies network management”. This time, the focus is on the Meraki Dashboard platform, its architecture, the device registration process and the steps for converting Cisco Catalyst equipment to cloud management mode.

In the previous article, we briefly presented the Meraki product range and some of the advantages offered by the Meraki ecosystem, particularly by the centralized cloud management platform, Meraki Dashboard: https://www.arcticstream.ro/en/blog/meraki-what-it-is-and-network-benefits.
In this article, I will detail more aspects of this platform, starting from the ease of use with Meraki devices, up to the versatility offered by seamless integration with Cisco equipment.
Meraki Dashboard
https://dashboard.meraki.com
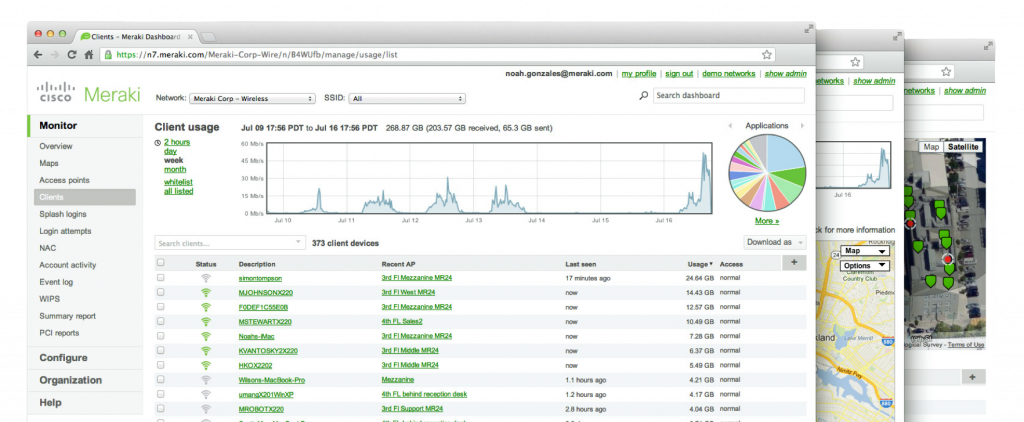
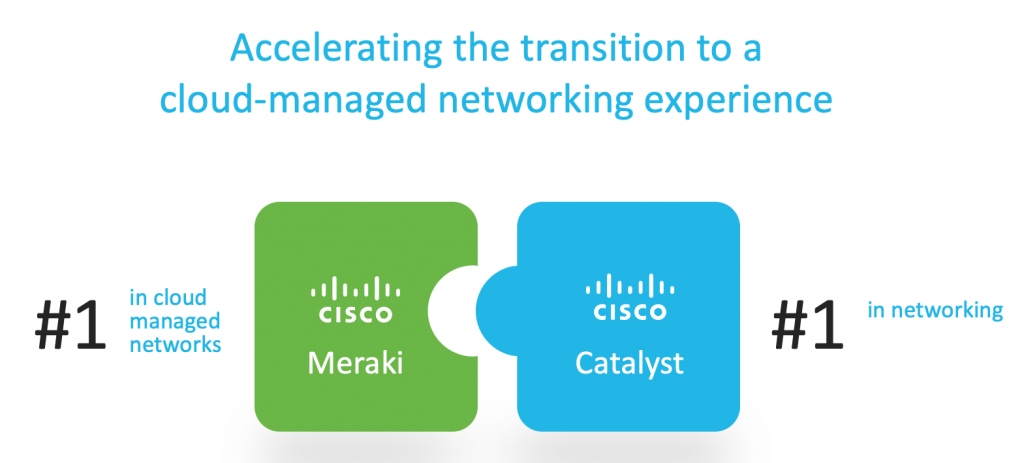
The Meraki Dashboard centralized cloud management platform provides visibility and centralized control over Meraki and Cisco network devices through a single control panel, without the cost and complexity of wireless controllers or on-prem management systems. Integrated with the entire Meraki product portfolio and the most important Cisco products, cloud management offers rich, scalable and intuitive centralized management capabilities for networks of any size. The intuitive interface of this platform eliminates costly training or additional staff while ensuring role-based access administration and auditable logs.
Meraki Dashboard also features zero-touch provisioning for rapid network deployment based solely on device serial numbers, along with continuous monitoring with alerts and automatic system updates. The cloud architecture of Meraki Dashboard provides centralized information and features live tools that offer instant analysis of performance, connectivity and much more. Using live tools, network administrators no longer need to travel to the site to perform routine troubleshooting tests or deal with remote network access.
Visibility into devices, users and applications gives administrators the information needed to enforce security policies and ensures the performance required by today’s demanding network environments. The available troubleshooting tools: ping, traceroute, throughput and packet captures, are integrated directly into the Meraki Dashboard, dramatically reducing resolution times and enabling troubleshooting at remote locations without on-site IT staff.
Meraki Dashboard Architecture
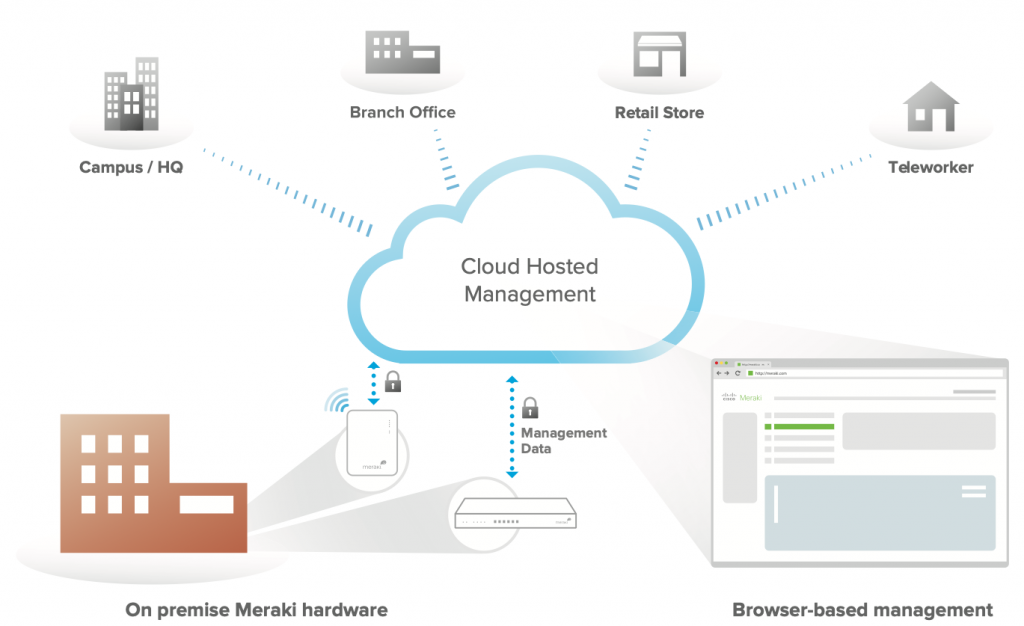
The Meraki Dashboard architecture provides feature-rich network management without on-site management devices or WiFi controllers. Each device registered in Meraki Dashboard connects via the internet to Meraki data centers, which run the Meraki Dashboard cloud management platform. These connections, secured by SSL, use a patented protocol that provides real-time visibility and control while using minimal bandwidth overhead (typically 1 kbps or less).
Instead of traditional command-line-based network configuration, Meraki Dashboard provides a web-based control panel, offering visibility and control over tens of thousands of devices, anywhere in the world. The available tools, designed to scale to large and distributed networks, make policy changes, firmware updates and new branch deployments simple and fast, regardless of size or location. Meraki’s real-time protocols combine the real-time availability of on-premises management applications with the simplicity and centralized control of a cloud application.
Each device registered in Meraki Dashboard is designed to operate at the network edge. Management data (e.g., configuration, statistics, monitoring, etc.) flows to the Meraki cloud through a secure internet connection, while user data (web browsing, internal applications, etc.) does not flow through the cloud, but directly to its destination on the LAN or through the WAN. Since all packet processing is performed locally, end-user functionality is not compromised if the network’s connection to the cloud is interrupted. The Meraki Dashboard platform is designed to distribute computing and storage across independent server clusters in geographically isolated data centers. This means any server or data center can fail without affecting customers or the rest of the system. Furthermore, the design of Meraki’s data centers has been proven to support tens of thousands of devices simultaneously.
Creating a user account and an organization on Meraki Dashboard
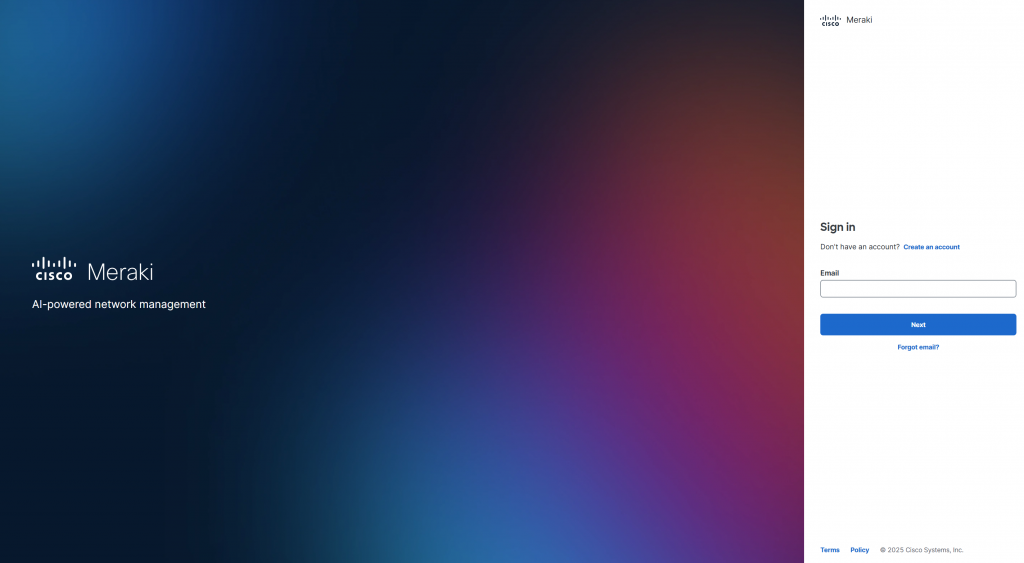
To access the Meraki Dashboard centralized management platform, you need to create a user account and an organization. With a single account, you can access multiple organizations. Within an organization, you can create multiple networks containing multiple devices from different locations. To get started, navigate to https://dashboard.meraki.com and click on “Create an account”. After selecting your region, all you need to do is fill in your details (email address, full name, desired password, company name and optionally the default address for your organization), complete the reCAPTCHA validation and click the “Create account” button. Once the user account has been created, you can start defining one or more networks and their specific configurations, or you can proceed to the next step of adding devices.
Registering Meraki devices in the organization
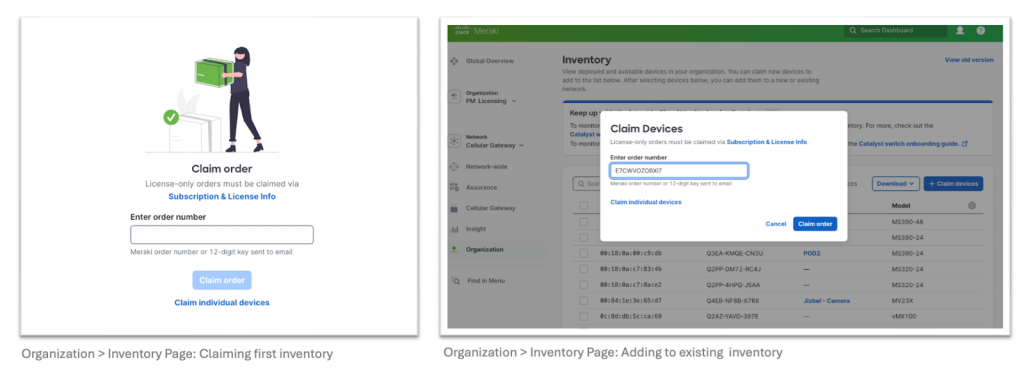
After placing an order for Meraki equipment and/or licenses, you will receive a confirmation email at the address provided during the order, containing a “Claim Key” that facilitates adding all the devices from the order to your organization in a single step. To start the process of claiming this “Claim Key”, simply navigate to one of the following menus:
- Network-wide > Configure > Add Devices
- Organization > Configure > Inventory
From here, you can add all the ordered items in a single step using the “Claim Key” mentioned above, or you can add each device individually using its serial number from the box.
Once you have added the Meraki devices to the organization, you can assign them to a specific network and begin configuring them before they are powered on, or even before they are delivered to the final location, because upon first boot they will automatically pull from the Meraki cloud both the latest available software version and the latest configurations from the organization they belong to, enabling a rapid installation.
Registering Cisco Catalyst 9000 switches in the organization
In addition to traditional Meraki devices that can only be used in cloud management mode, certain models of Cisco Catalyst 9000 series switches can be converted from the default CLI / DNA management mode to cloud management mode in order to be registered in Meraki Dashboard. Specifically, IOS XE 17.15+ comes with the ability to convert supported Catalyst 9000 switches (including the 9200L) from CLI / DNA management mode to cloud management mode. This functionality migrates the switch or switch stack to be fully managed by the Meraki Dashboard platform. Note: During the migration process, the switch configuration, flash memory, USB flash memory, and all storage will be formatted and reconfigured at the Meraki runtime. The Cisco Catalyst 9000 models supported by the conversion process are as follows:
| Family | Model | Minimum required version |
| C9200L | C9200L-24T-4G/4X, C9200L-24P-4G/4X, C9200L-48T-4G/4X, C9200L-48P-4G/4X, C9200L-48PL-4G/4X, C9200L-24PXG-4X/2Y, C9200L-48PXG-4X/2Y | 17.15+ |
| C9200L-M | All available C9200L-M models | |
| C9300/X/L-M | All available C9300/X/L-M models | |
| C9300 | C9300-24UB, C9300-24UXB, C9300-48UB, C9300-24H, C9300-48H, C9300L-24T-4G, C9300L-48T-4G, C9300L-24P-4G, C9300L-48P-4G, C9300L-48PF-4G, C9300L-24UXG-2Q, C9300L-48UXG-2Q, C9300LM-48UX-4Y, C9300LM-48U-4Y, C9300LM-24U-4Y, C9300LM-48T-4Y | 17.18+ |
| C9200 | C9200-24T/P/PB/PXG, C9200-48T/P/PL/PB/PXG | |
| C9200CX | C9200CX-12T-2X2G, C9200CX-12P-2X2G, C9200CX-8P-2X2G, C9200CX-8UXG-2X, C9200CX-12P-2XGH, C9200CX-8P-2XGH, C9200CX-8UXG-2XH | |
| C9500H | C9500-48Y4C, C9500-24Y4C, C9500-32C, C9500-32QC |
The conversion process for Cisco Catalyst 9000 switches
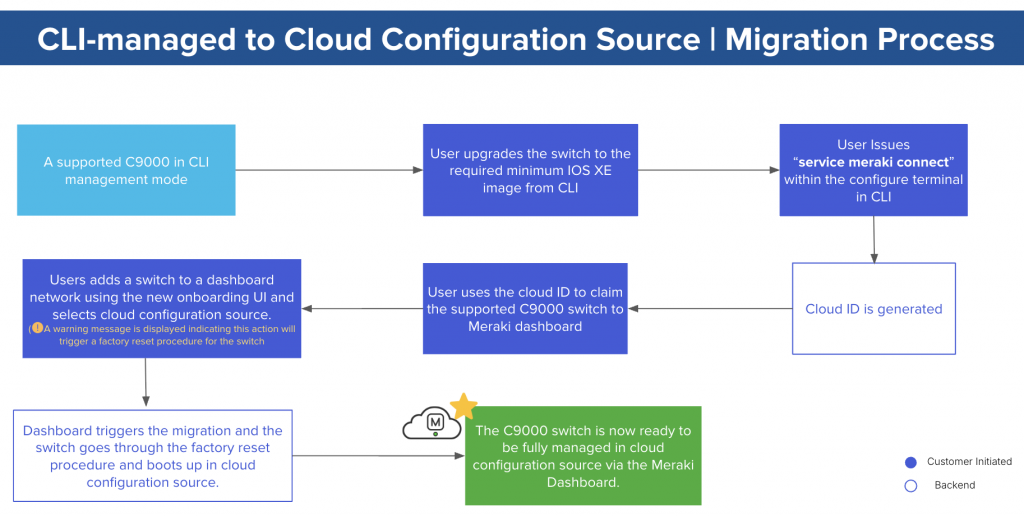
To successfully convert the supported Cisco Catalyst 9000 switch models from the default CLI / DNA management mode to Meraki cloud management mode, you must follow these steps:
- Validate the compatibility of the switch, the software version, and the connected modules by running the command: “show meraki compatibility” and, if necessary, resolve the mentioned incompatibilities.
- Verify the switch’s connectivity to the internet and to the Meraki Dashboard platform by running the command: “ping dashboard.meraki.com” and, if necessary, configure connectivity.
- Initiate the conversion of the switch management mode by running the commands: “configure terminal” and “service Meraki connect” and note the “Cloud ID” generated after running the commands.
- Verify the connectivity status with the Meraki cloud by running the command: “show meraki connect”. Once the Meraki tunnel status indicates “Config fetch succeeded”, the switch can be registered.
- Register the switch in the Meraki Dashboard organization using the “Cloud ID” generated in step 3.
- Add the switch to a network in the Meraki Dashboard organization to start the migration process. Note: The process can take up to 15 minutes and all storage on the switch will be formatted.
- After the conversion and registration of the migrated switches in the Meraki organization, licenses are required.
Note: If you wish to revert to the default CLI / DNA management mode, you will need to contact the Meraki Support team. After this process, the switch will be rewritten with factory settings.
The conversion process for Cisco Catalyst 916x access points
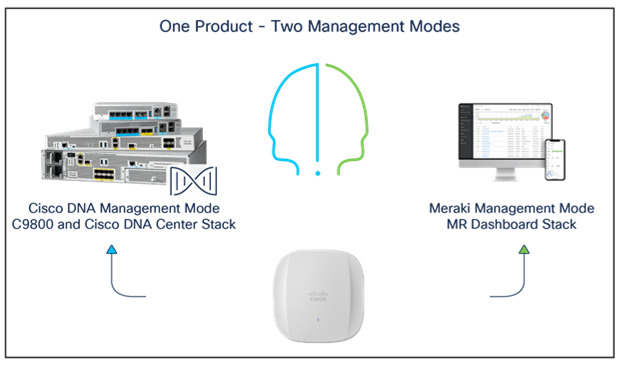
Access points from the Cisco Catalyst 916x series can be ordered from the start with either local DNA / WLC management or Meraki Dashboard cloud management (the part number contains -MR). If you wish to convert the management mode of these APs from local DNA / WLC management mode to Meraki Dashboard cloud management, you must follow these steps:
- Ensure that the AP is registered to a Cisco Catalyst 9800 WLC controller running at least software version IOS XE 17.9.1 and that the AP has access to the Meraki cloud (dashboard.meraki.com).
- Log in to the WLC controller to which the access point is registered and navigate to the “Configure > Wireless > Migrate to Meraki Management Mode” menu.
- Select the desired AP (or multiple) and click the “Migrate to Meraki Management Mode” button to start the validation process. Once all checkmarks turn green, click “Next”.
- Read the warning presented, click “Agree” and then “Yes” to confirm the migration process.
- Copy or download the list of generated Meraki Serial Number and AP name pairs.
- Use the list of pairs above to register the APs in your organization.
- After the conversion and registration of the migrated APs in the Meraki organization, licenses are required.
Note: If you wish to revert to the default DNA / WLC management mode, you will need to contact the Meraki Support team. After this process, the AP will be rewritten with factory settings.
The new WiFi 7 Cisco wireless CW917x Access Points
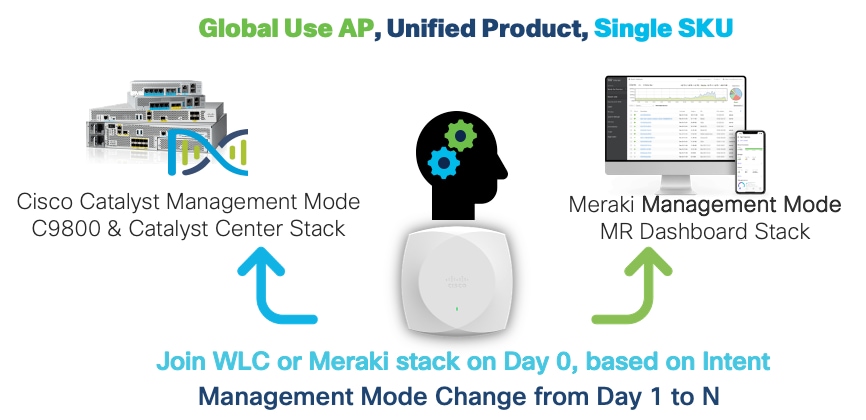
Fortunately, the new WiFi 7 Cisco Wireless CW917x access points have a unified part number and are capable of automatically detecting both the desired management mode and the regulatory domain:
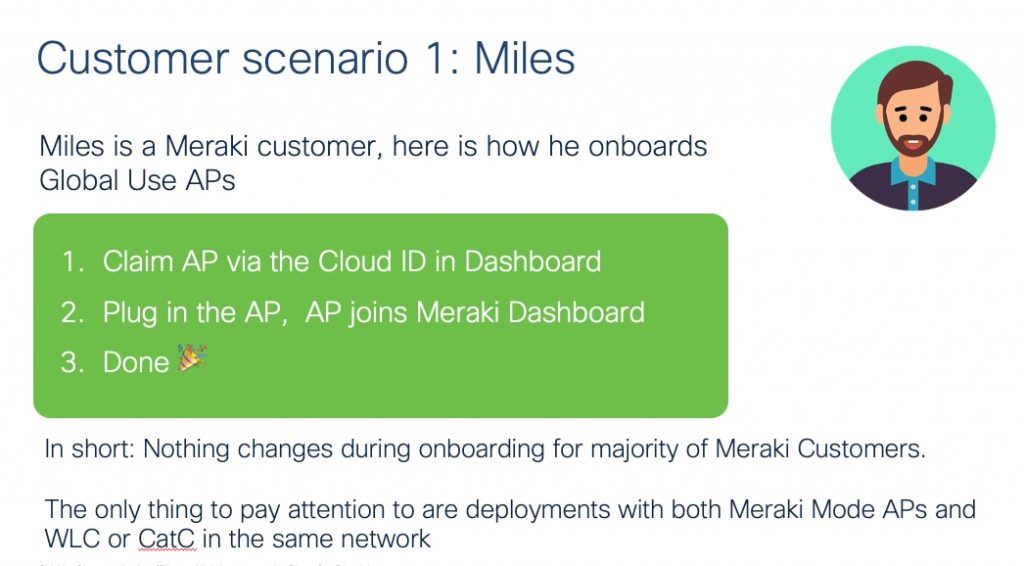
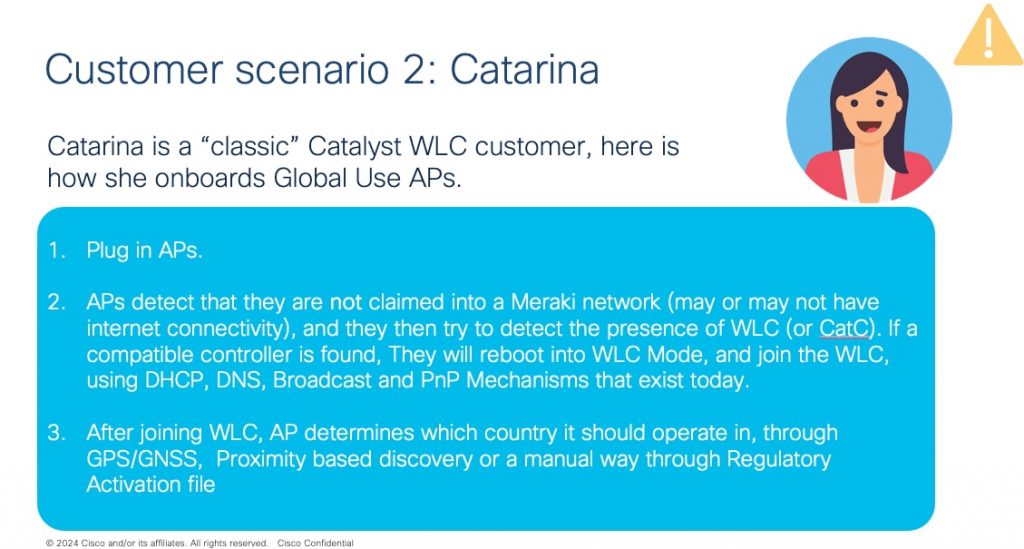
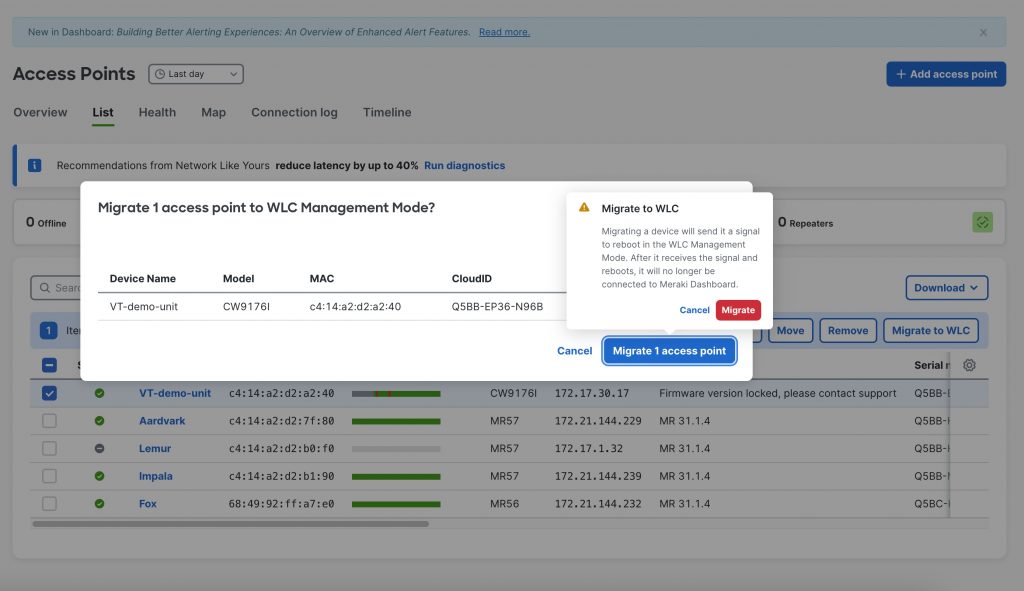
Note: If you wish to convert the management mode after installation, opening a support case is no longer necessary, conversion from Meraki to WLC is now done directly from the Meraki Dashboard:
The Meraki mobile app – “the cloud” in your pocket
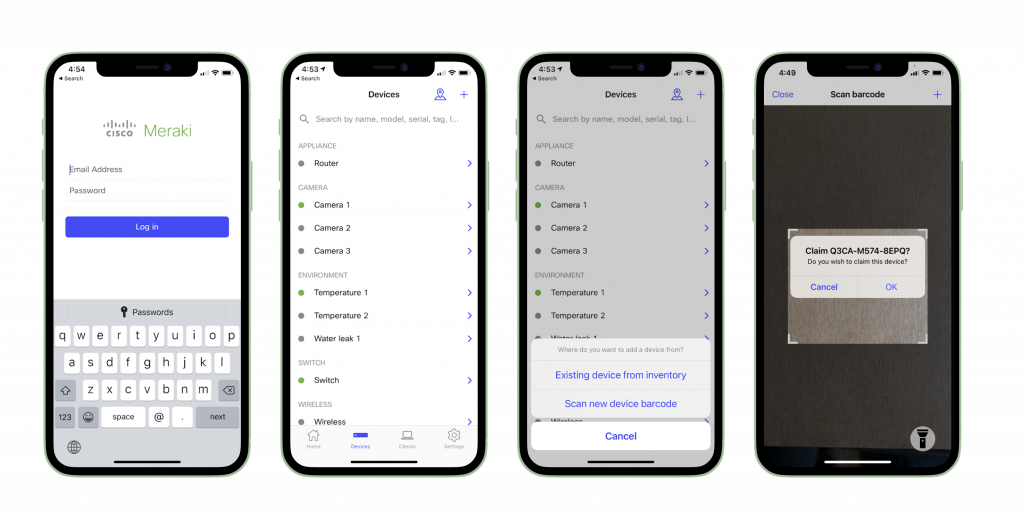
With the Meraki mobile app, you get everything you need to manage your network wherever you are. You can quickly access device alerts, identify potential clients with issues and easily navigate between networks and organizations. For devices, you can access real-time usage information, view and edit details and run troubleshooting tools. For network clients, you can view application usage, update a client’s group policy and check connection details. You can also receive instant push notifications, so the next time problems occur in your network during dinner, you can resolve the issue gracefully between the main course and dessert.
Using continuous troubleshooting, you can clearly track connections from a specific client directly in the app. It is also very easy to register devices in the organization from anywhere by scanning the barcode, adding the location and a mounting photo, all in one place. This means your walk is no longer interrupted by a misconfigured VLAN. That is the power of the Meraki platform in an app, just make sure you watch where you’re going while updating settings.
For more information about Meraki solutions or to discuss your infrastructure needs, you can contact us at [email protected].